
How to
Attaching a Calculation Method to a Trend Log List
You attach a calculation method to a trend log list to process the recorded values and present the result.
Use a calculation method to process the records of the trend log before presenting them in a trend log list or a trend chart. The original records in the trend log are not affected by the calculation method. The calculation method is applied to the trend log records grouped by a specific time interval.
The following calculation methods are available:
None
Maximum
Minimum
Average
Sum
Delta
Delta over period
Meter consumption
Adapt the period so it contains the required amount of records to generate a correct calculation.
If a calculation method is connected to an interval trend log with delta, make sure that the period and delta are adapted for the calculation.
Maximum
The maximum value of each period is presented.

Maximum calculation method, schematic
If the log point is offline or no value is produced during the interval, no value is displayed.
Minimum
The minimum value of each period is presented.

Minimum calculation method, schematic
If the log point is offline or no value is produced during the interval, no value is displayed.
Average
The average of the values in each period is calculated and presented.

Average calculation method, schematic
If the log point is offline or no value is produced during the interval, no value is displayed.
Sum
The sum of the values in each period is calculated and presented.

Sum calculation method, schematic
Delta
The change to the previous value is calculated and presented.

Delta calculation method, schematic
Delta over Period
The change over a period is calculated and presented. The value at the period limit is often interpolated, based upon the last value in the old period and the first value in the new period.

Delta over period calculation method, schematic
Meter Consumption
Meter consumption is a delta over period calculation with meter functionality. For more information, see Meter Trend Logs .
Period Timestamps in Trend Charts and Trend Log Lists
When a calculated value for a period is presented, the middle of the period is used as the timestamp.
Example:
The calculated value for the period 8:00-9:00 is stamped 8:30. If there is a value at 9:01, the next period is 9:00-10:00, which is stamped as 9:30. The full period may not have passed yet, but the value can be presented even if parts of the period are in the future.
In WorkStation, in the System Tree pane, select the trend log list you want to attach a calculation method to.
On the Trend Log List toolbar, click the Open trend log list settings button
.action_zoom_plus_stroke 
In the Calculation method box, select a calculation.
action_zoom_plus_stroke 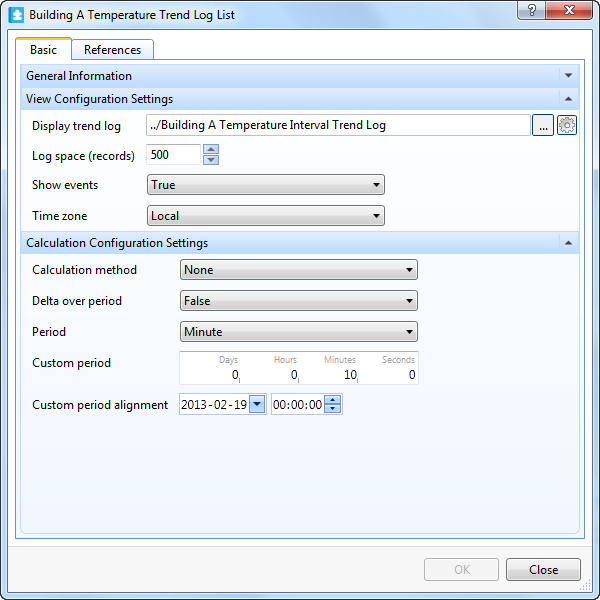
In the Delta over period box, select True if the calculation method is a delta calculation with periods.
In the Period box, select the time span for which the calculation method is to be executed.
Note:If Custom is selected in the Period box, enter a custom time span for which the calculation method is to be executed in the Custom period box and the time when you want the custom period to start in the Custom period alignment boxes.
To calculate the required number of records for a trend log, multiply the number of records in one day with the number of days you want the trend log to record. For example, the interval of the trend log is set to 1 hour, then this gives 24 recorded values per day. The trend log should record at least one month of recorded values equal to 31 days. For example, the number of records = 24 x 31 = 744.
In the Custom period box, enter a custom time span for which the calculation method is to be executed.
In the Custom period alignment boxes, enter the time when you want the custom period to start.
Click OK .
A calculation method is now attached to the trend log list.
 Calculation Methods
 Trend Log List Properties
 Meter Trend Log Calculation Fails