
How to
Configuring the X-Axis with an Absolute Time Span
You configure the time span of a trend chart x-axis to display the records that are recorded within a specific period of time.
The x-axis of the trend chart represents time. The time span of the axis can be set with a fixed start and end time or with an end time relative to the present time. The axis can be quick-scaled to show the last hour, last day, last month, or last year.

Absolute time span and relative time span, schematic
The y-axis refers to the measurement unit that the variable represents. The scale of the y-axis can be set manually or by auto scale. You can configure the trend chart to present series on one y-axis or two y-axes, one to the left and one to the right. Use two y-axes to present series with different ranges in the same trend chart.

One y-axis and two y-axes, schematic
To make reading easier, grid lines can be shown in the trend chart. Grid lines can be shown in both the x- and y-direction, independent of each other.

Grid lines, schematic
In WorkStation, in the System Tree pane, select the trend chart you want to configure.
On the Trend Chart toolbar, click the Open trend chart settings button
.action_zoom_plus_stroke 
In the Time mode box, select Absolute (start and end time) .
action_zoom_plus_stroke 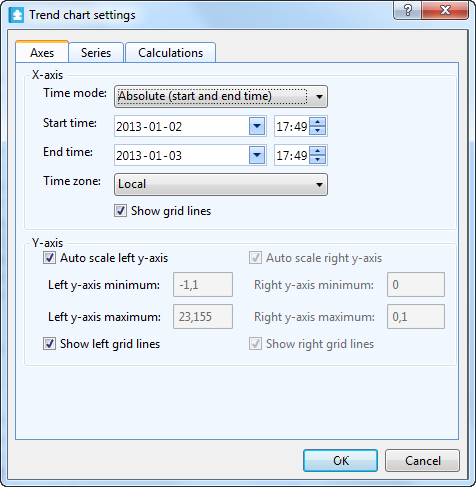
In the Start time boxes, type the x-axis leftmost date and time.
In the End time boxes, type the x-axis rightmost date and time.
Click OK .
The x-axis is now configured with an absolute time span.
 Trend Chart Axes
Configuring the X-Axis with a Relative Time Span
Trend Chart Axes
Configuring the X-Axis with a Relative Time Span
 Trend Chart Event Icons
Trend Chart Settings Dialog Box – Axes Tab
Trend Chart Event Icons
Trend Chart Settings Dialog Box – Axes Tab
 Trend Chart Does Not Show Trend Log Series