
How to
Creating a Real-Time Plot Trend Chart
You create a real-time plot trend chart to display a variable in real time.
The real-time plot is a variable displayed directly in the trend chart. The real-time plot is an instant reflection of the variable, so the history of the real-time plot is lost when the trend chart is closed. However, the history is not lost for I/O points that have implicit logs where approximately 500 records of history are displayed.

Real-time plot, schematic
A real-time plot trend chart updates and draws a solid series each time it registers that the variable has a new value. If the variable remains on the same value, the series is drawn as a dotted line.
When you save a real-time plot trend chart, a trend chart object is created that you can reach from the System Tree pane.
A real-time plot can only be displayed in a trend chart and not in a trend log list.
In WorkStation, in the System Tree pane, select the variable you want to display in a real-time plot trend chart.
On the Actions menu, point to View , and then click New Trend chart.
action_zoom_plus_stroke 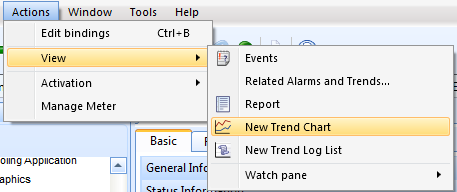
Click the Save button
.action_zoom_plus_stroke 
Browse to where you want to save the real-time plot trend chart.
Click Save .
By saving the real-time plot trend chart, a trend chart object is created in the System Tree pane.
 Real-Time Plotting
 Trend Chart View
Saving the Trend Chart Settings
Trend Chart View
Saving the Trend Chart Settings