How to
Creating a Trend Chart that Monitors a Variable in Real-Time
You create a trend chart that monitories a variable in real-time, for example, to access and check the current status of the variable.
The real-time plot is a variable displayed directly in the trend chart. The real-time plot is an instant reflection of the variable, so the history of the real-time plot is lost when the trend chart is closed. However, the history is not lost for I/O points that have implicit logs where approximately 500 records of history are displayed.

A real-time plot trend chart updates and draws a solid series each time it registers that the variable has a new value. If the variable remains on the same value, the series is drawn as a dotted line.
When you save a real-time plot trend chart, a trend chart object is created that you can reach from the System Tree pane.
A real-time plot can only be displayed in a trend chart and not in a trend log list.
In WorkStation, in the System Tree pane, select the folder or SmartStruxure server where you want to create the trend chart.
On the File menu, point to New and then click Trend .
Select Trend Chart .
action_zoom_plus_stroke 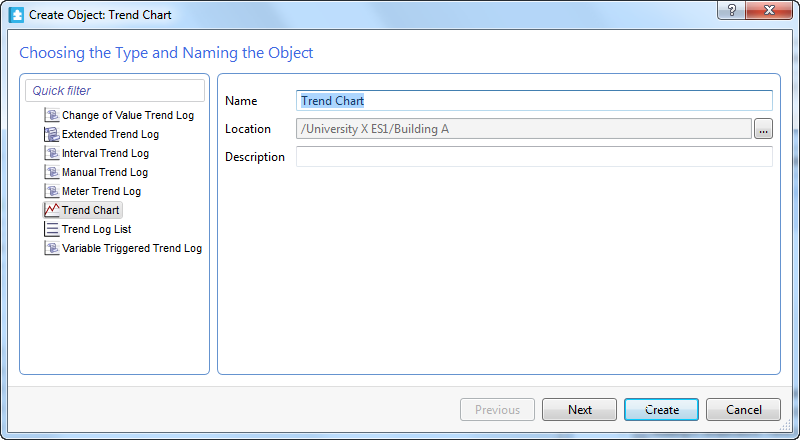
In the Name box, type a name for the trend chart.
In the Description box, type a description.
Click Next .
In the Time mode box, select Absolute to manually specify the x-axis start and end point.
action_zoom_plus_stroke 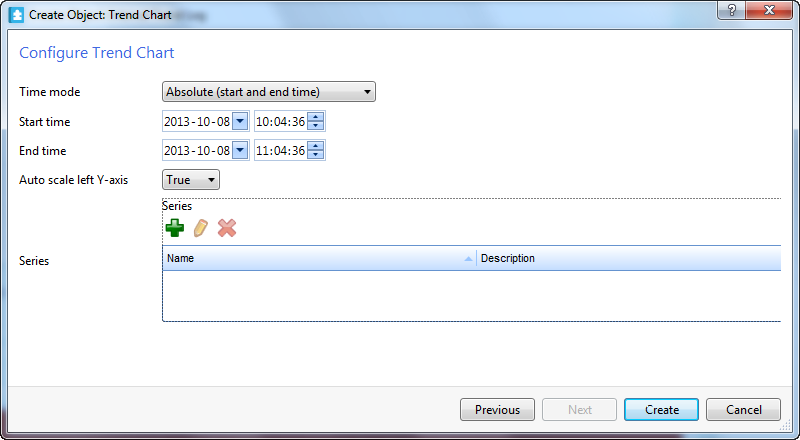
In the Start time box, type the absolute start time (the leftmost point of the x axis).
In the End time box, type the absolute end time (the rightmost point of the x axis).
In the Auto scale left y-axis box, select True so the y-axis adapts itself to displayed series.
Click the Add
button.action_zoom_plus_stroke 
Select Real Time Trend Series .
action_zoom_plus_stroke 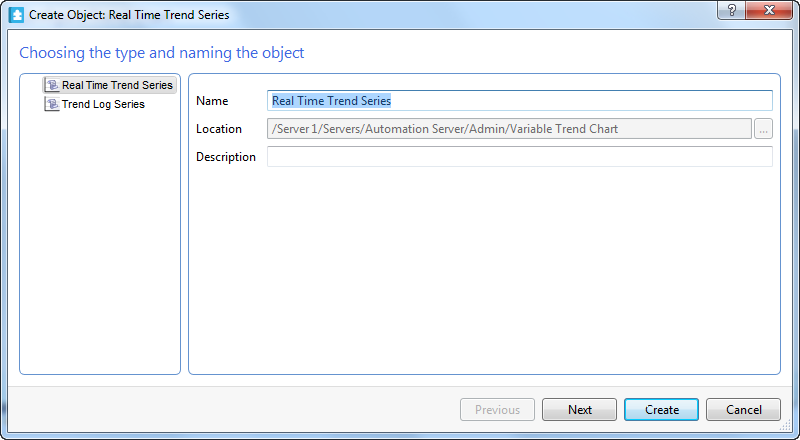
In the Name box, type a name for the series.
In the Description box, type a description.
Click Next .
In the Display variable box, enter the variable you want to display in the trend chart.
action_zoom_plus_stroke 
In the Weight box, select the weight of the series.
In the Show markers box, select True to display a marker for each recorded.
Click Create .
In the Configure real-time trend series dialog box, click Create .
The real-time trend series trend chart is created in the selected folder.