How to
Creating an Activities Per User Dashboard Report
You create an Activities Per User dashboard report when you want to enter and save filtering criteria, and then run the report in the future based on the same filtering criteria.
A dashboard report is a report that processes fixed or predefined filtering criteria to generate report output.
Unlike prompted reports, dashboard reports process the report output based on the predefined filtering criteria and generate the report output when you select the report. You do not need to enter filtering criteria or click the Run button to generate the report.
In the Reports Tree, dashboard reports are identified by a red dot next to the report name. The icon does not appear next to dashboard reports in the System Tree pane in WorkStation.

You can create dashboard reports in both WorkStation and your Web browser using the WebReports dashboard option. You select the option when you want to create a report that uses the same filtering criteria each time you run the report. For example, suppose you want an alarm report to process with a fixed date range, such as week to date. When you create the report, you can enter the fixed date range and then save the report as a dashboard report. The next time you run the report, the report processes using the fixed date range as the filtering criteria. You do not need to reenter the date range to filter your report output.
To generate and view a dashboard report in WorkStation, you select the report in the Reports folder in the System Tree pane.

After you select the report, the report output displays in the Work area. You do not need to enter any filtering criteria, or click the Run report button to generate the ouput.
To generate and view a dashboard report in your Web browser, you log on to the WebReports Web site, and then select a report in the Reports Tree.

After you select the report, the report output displays in your Web browser. You do not need to enter any filtering criteria, or click the Run report button to generate the output.
You also create dashboard reports when you want to use WebReports Schedules and run reports on specified days. For more information, see Schedules for Dashboard Reports ..

In WebReports, on the menu bar, click View .
In the Reports Tree , expand Production Reports and then select Activities Per User .
In the Date Range Filter box, select one of the following filter options to define the start time and end time for the report:
Select one of the predefined date range filters.
Select Fixed Date , and in the Start Report Date/Time boxes, enter a start date and type a start time. In the End Report Date/Time boxes, enter an end date and type an end time.
action_zoom_plus_stroke 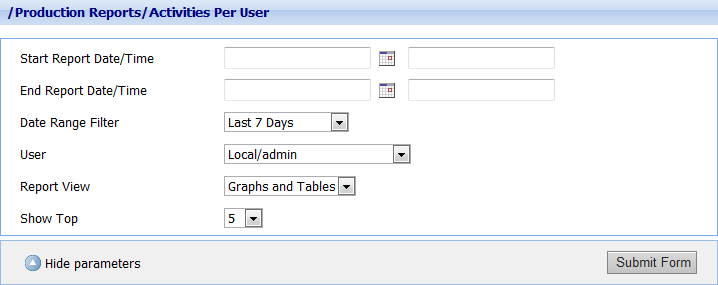
In the User box, select the user you want to view activities for.
Important:You can only create reports for users that have performed some actions, for example, logged on to the system or created an object.
In the Report View box, select how you want the information to be displayed.
In the Show Top box, select the number of user activities you want in the report.
action_zoom_plus_stroke 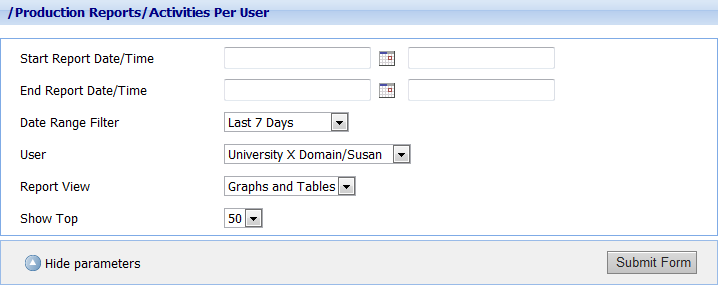
Click Submit Form .
Click Save as .
In the Report name box, type a folder name and report name for the dashboard report.
action_zoom_plus_stroke 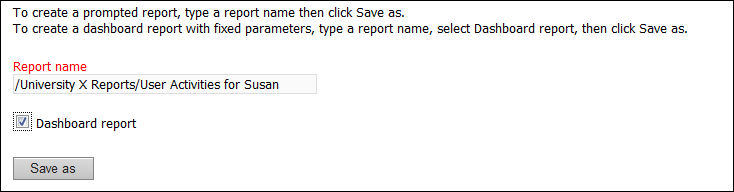
Select Dashboard report .
Click Save as .
Click OK .