
How to
Showing Trend Chart Grid Lines
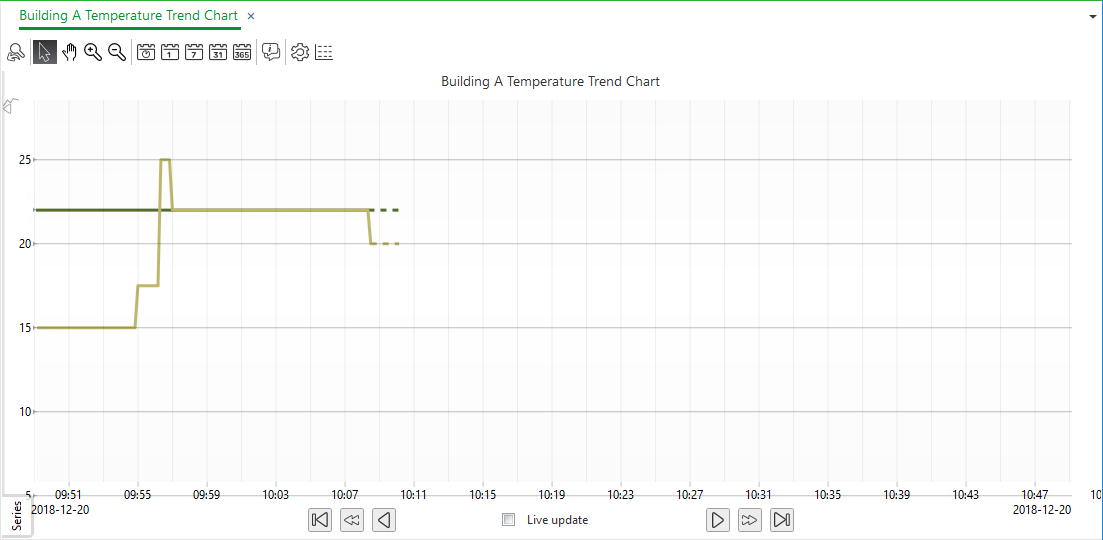
You show the trend chart grid lines on the x-axis and the y-axis to make the chart easier to read.
Use the Axes tab to configure the properties of the chart axes.

Axes tab
|
Component |
Description |
|
Time mode |
Select the time mode of the x-axis.
|
|
Start time |
Enter the absolute start time when Time mode is set to Absolute. This time is the leftmost point of the x-axis.
|
|
End time |
Enter the absolute end time when Time mode is set to Absolute (start time and end time) . This time is the rightmost point of the x-axis. |
|
Time span |
Type the relative time span of the x-axis when Time mode is set to Relative (to current time) . The rightmost point of the x-axis is the current time. |
|
Time zone |
Select time zone for the trend chart. The time zone is the displayed time perspective of the trend log. |
|
Show grid lines |
Select to show horizontal grid lines. |
|
Auto scale left y-axis |
Select to activate auto scale. The scale of the left Y-axis adapts itself to the displayed series.
|
|
Left y-axis minimum |
Type the minimum value of the left y-axis. |
|
Left y-axis maximum |
Type the maximum value of the left y-axis. |
|
Show left grid lines |
Select to show grid lines on the left y-axis. |
|
Auto scale right y-axis |
Select to activate auto scale. The scale of the right y-axis adapts itself to the displayed series. |
|
Right y-axis minimum |
Type the minimum value of the right y-axis. |
|
Right y-axis maximum |
Type the maximum value of the right y-axis. |
|
Show right grid lines |
Select to show grid lines on the right y-axis. |
In WorkStation, in the System Tree pane, select the trend chart you want to configure.
On the Trend Chart toolbar, click the Open trend chart settings button
.action_zoom_plus_stroke 
Below the Time zone box, select Show grid lines to show grid lines originating from the x-axis scale.
Select Show left grid lines or Show right grid lines to show grid lines originating from the y-axis scale.
Click OK .
Grid lines are now shown in the trend chart. Repeat the procedure to hide the grid lines.
 Trend Chart Axes
Trend Charts
Trend Chart Axes
Trend Charts
 Trend Chart Settings Dialog Box – Axes Tab
Trend Chart Event Icons
Trend Chart Settings Dialog Box – Axes Tab
Trend Chart Event Icons