
How to
Adding a Trend Log Series to a Trend Chart
You add a trend log series to a trend chart to compare trend data from different logs or variables.
Trend charts are a way to graphically present trend logs. A trend chart can contain one or more trend logs that are represented in the trend chart by lines or bars.
You can also add and remove trend logs from a trend chart. This makes it easy to compare different trend logs, for example the energy consumption compared to the average temperature.

Trend chart in WorkStation
Trend Chart Navigation in WorkStation
The trend chart contains a lot of tools for easy navigation in the chart. You can scroll or use the predefined settings to focus on the time span you want to see.
For more information, see Trend Chart Navigation in WorkStation .
Trend Chart Navigation in WebStation
The trend chart contains a lot of tools for easy navigation in the chart. You can scroll or use the predefined settings to focus on the time span you want to see.
For more information, see Trend Chart Navigation in WebStation .
Trend Chart Series in WorkStation
You can display the trend logs as trend log series in a trend chart in a number of ways. For example, you can change the color and weight of the trend log line, or display markers at the time where the trend log value was sampled.
For more information, see Trend Chart Series in WorkStation .
Trend Chart Series in WebStation
You can display the trend logs as trend log series in a trend chart in a number of ways. For example, you can change the color and weight of the trend log line, or display markers at the time where the trend log value was sampled.
For more information, see Trend Chart Series in WebStation .
Trend Chart Axes in WebStation
A trend chart displays the records of a trend log or an extended trend log as a series.
For more information, see Trend Charts .
In WebStation, in the System Tree pane, select the trend chart you want to add a trend log series to.
action_zoom_plus_stroke 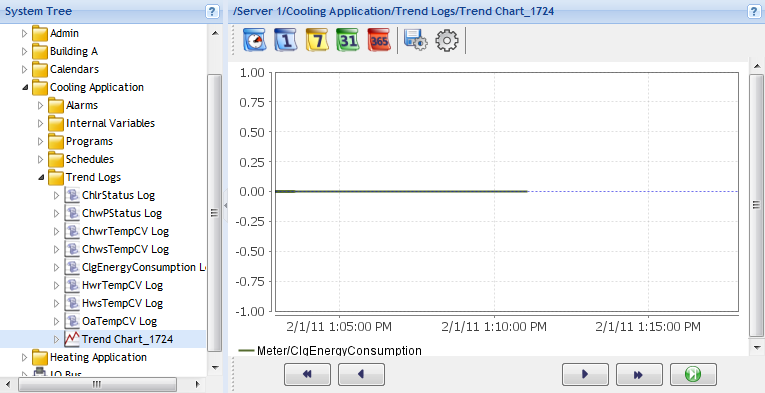
In the System Tree pane, right-click the trend log, point to Open chart , and then select Add to already open chart(s) .
action_zoom_plus_stroke 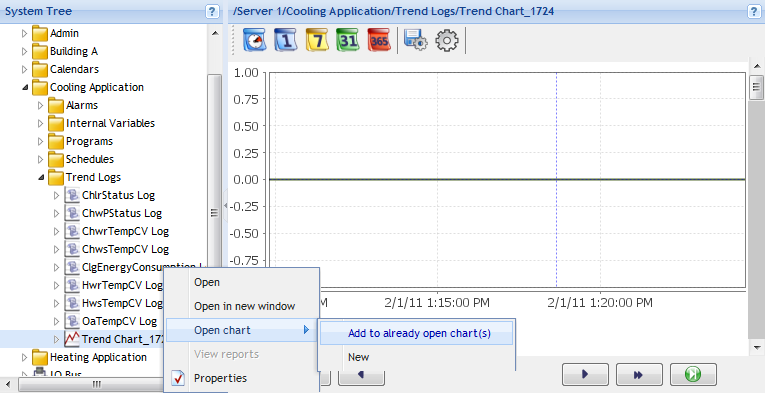
To save the changes to the trend chart, click the Save current settings button
.action_zoom_plus_stroke 
The trend log series is now added to the trend chart.

Trend chart showing two trend log series
 Trend Chart Series in WebStation
How Trend Charts Work
Displaying Specific Time Spans of a Trend Chart
Changing the Line Weight of a Trend Chart Series
Changing the Color of a Trend Chart Series
Changing the Presentation Type of a Trend Chart Series
Showing Markers in a Trend Log Series
Viewing Multiple Tooltips in a Trend Chart
Hiding a Series in a Trend Chart
Removing a Trend Chart Series
Saving Current Trend Chart Settings
Trend Chart View
Trend Chart Series in WebStation
How Trend Charts Work
Displaying Specific Time Spans of a Trend Chart
Changing the Line Weight of a Trend Chart Series
Changing the Color of a Trend Chart Series
Changing the Presentation Type of a Trend Chart Series
Showing Markers in a Trend Log Series
Viewing Multiple Tooltips in a Trend Chart
Hiding a Series in a Trend Chart
Removing a Trend Chart Series
Saving Current Trend Chart Settings
Trend Chart View
 Context Menu
 – Open Chart Submenu
Trend Chart Toolbar
Context Menu
Context Menu – Open Chart Submenu
Trend Chart Toolbar