
Specifications
WorkStation
Introduction
StruxureWare Building Operation WorkStation is a fully featured environment for operating and administering all aspects of the software. WorkStation is the window through which users can monitor their energy usage and continuously improve their building’s efficiency.
Operator features
WorkStation is the interface where users and engineers access their SmartStruxure servers. You can view and manage graphics, alarms, schedules, trend logs, and reports. Engineers can configure and maintain all aspects of a SmartStruxure solution.
A SmartStruxure solution requires each user to have an account. Access can be through an account maintained by the SmartStruxure solution or through a Windows Active Directory account. IT policies for password formatting, aging, and uniqueness are supported and enforced.
The software adapts the displayed language, measurement system, and date/time format to the operating system settings. Language and measurement system can easily be switched from within WorkStation. Translations of WorkStation are delivered as part of the installation or as separate language packs that are easy to install and deploy.
A SmartStruxure solution has the flexibility to be fully customized to the viewing preference of individual users. The main interface, called the workspace, is a panel-based interface where users can select, position, and re-size a wide variety of components, such as alarms, graphics, and editors. A default Workspace is assigned to each user account, but users can easily modify, save, and create multiple versions to choose from. The Workspace can also be modified as needed to address real-time issues.
Alarms need to be assessed and responded to quickly. Through WorkStation, a SmartStruxure solution can present a large number of alarms in a simple and efficient way to ensure that no alarm is overlooked. Alarms can be color coded, grouped, and filtered for maximum efficiency.
WorkStation can even assign alarms to a user or a group of users by a dispatch center or manager. Using a filter, users can view only the alarms assigned to them and decide whether or not to accept the assignment.
Acknowledgement and response alarms can be acknowledged with varying degrees of detail, depending on the importance of the alarm. Users can be required to enter notes or select from a standard list to explain how the issue was resolved. WorkStation can present the user with instructions or a specific view of their system that shows details of the affected equipment. The alarm log records the user’s actions.

Alarms view
A SmartStruxure solution supports customized views of all system events, including alarms, and user activity. Each view can be filtered on any event property. Fonts, colors, column sizes, and order can all be specified by the user.
It is important to log more than basic activity. The software logs every action with a timestamp, the user who performed the action, and the values that were changed.
The software can trend data in many ways, including a periodic method (every day, hour, minute) and a change-of-value (COV) method that only records when a defined threshold has been passed. These trend logs can be shown in trend lists and charts to visualize patterns for diagnostic and optimization purposes. Multiple series can be presented in a single chart or list, so that data points can be easily compared.

Trend Chart view
Trend charts are easy to create. The color and weight of all lines can be specified. Display of digital data is automatically shown as high and low horizontal bars, eliminating the need for additional scaling. Log data can be presented as average, minimum, maximum, or delta in addition to the actual log value itself. Users can zoom in to see details without losing clarity. A trend chart can have two different scales on the same chart to see how different data relate to each other.
Energy efficiency is achieved when equipment is running only when necessary. Schedules manage that process through a graphical interface that is easy-to-use. Change times with a few simple clicks of the mouse. The powerful Schedule Editor can set up recurring events (every Monday, every third Tuesday, or every January 1st) or an unlimited number of exceptions with priority levels. Schedules go beyond the basic on and off control by enabling direct control of analog values. For example, users can set schedule events to percentages to control lighting levels without writing a program.
WorkStation communicates using networking standards, such as DHCP, HTTP, and HTTPS. This makes installation easy, management simple, and transactions secure.
Communication between clients and the SmartStruxure servers can be encrypted using Transport Layer Security (TLS 1.2). The servers are delivered with a default self-signed certificate. Commercial Certification Authority (CA) server certificates are supported to lower the risk of malicious information technology attacks. Use of encrypted communication can be enforced for both WorkStation and WebStation access.
In a SmartStruxure solution, the graphics can be customized to provide the user interface required to effectively run each facility. Graphics are stored locally in the SmartStruxure servers and are available to authorized users from wherever they log on.

Sample graphic
A SmartStruxure solution uses scalable vector graphic technology so that users can zoom in to see details without losing clarity. Graphics are built once, but can be used on any display regardless of size or resolution. Vector graphic file sizes are small so they can be stored and served directly from the SmartStruxure server device.

Sample graphic
A standard live update simply shows the displayed values as conditions change in the field. With SmartStruxure solution's super dynamic live updates, all aspects of graphical elements can change when values change.

Sample graphic
Users can take control directly from a graphic and change setpoints, enable/disable equipment, and modulate actuators - all with a simple point-and-click action. A library of components is available online to choose from. These graphics can be further customized to meet the unique needs of every installation.
Engineering features
Push-button engineering features help a project stay on time and on budget. A SmartStruxure solution not only reduces project engineering but it also expands the possibilities for monitoring and control by delivering on-site customization tools.
An iBMS system can have thousands of created and configured objects. Quick recovery from an unexpected event, such as an unintended delete or hardware failure, is vital. A SmartStruxure solution has a built in Backup and Restore functionality that can backup, store, and restore from multiple copies of a SmartStruxure server’s database. This functionality resides on a SmartStruxure server and can be accessed and configured through WorkStation.
Configurations and programs can easily be transferred from one SmartStruxure solution to another with the import and export feature. The import interface provides a preview of the objects so users can confirm the content.
Direct connection of the WorkStation to all SmartStruxure servers ensures optimized configuration and operation.
The Device Discovery significantly reduces engineering time by detecting new devices on the network and automatically creating a corresponding device in the SmartStruxure solution.
Data is easily exchanged between points, programs, SmartStruxure servers, and other vendor's systems via a simple binding mechanism. The binding tool in a SmartStruxure solution is intuitive and is used to swiftly configure data exchange.
A system often can have hundreds of objects with the same configuration. One action creates and configures these duplicates with a mass change and create feature.
Today’s buildings demand more than basic control. They require applications that can be customized to meet specific building automation needs.
Unlike other software that requires factory involvement for non-standard or special applications, the SmartStruxure solution software can be easily customized. You can turn operational sequences into reality in the field to save both time and money on any project.
Unique to the industry, the SmartStruxure servers have both Script and Function Block programming options. This flexibility ensures that the best programming method can be selected for the application.
The Spreadsheet view allows creating and editing of multiple points in a tabular format rather than editing each point individually. The spreadsheet feature supports copy/paste of cell content to and from Microsoft Excel. The Spreadsheet view can be used for configuration of values, alarms, trends, the SmartStruxure server device’s I/O modules and points, as well as Modbus points.
StruxureWare Building Operation has a robust programming environment that enables multiple program editing at the same time. Simple cut and paste functionality ensures multiple programs work together to control a larger system.
You can assign each program to a specific task and cycle time that is appropriate for the program’s application. This ensures programs for critical applications run without any impact from other tasks. The sequencing of program execution is handled automatically by the SmartStruxure server.
There is no downtime while programming because the program runs even while it is being edited. When the program is saved, the code is replaced and the new sequence begins. The execution of other programs is not impacted during the updating process.
Inputs, outputs, and other objects in the system are connected through bindings, by the use of the binding tool. This binding reduces set-up time and increases system stability. No bindings are in the code itself. Each program becomes easy to copy throughout the system, which saves time and ensures consistency.

Script Editor
Display color codes for every part of a line in Script
Auto-correct and Auto-complete displays syntax errors and completes known keywords and declared variables
Cut/Copy/Paste, Find/Replace, Undo/Redo, Goto Line/Declaration/Definition functionality
Customize font type, size, color, and background color of the editing environment
Save sections (snippets) of code and quickly insert them into other programs
Insert a keyword into the code by selecting the keyword from a quick selection box
Reference a local variable or constant throughout a program
Display a list of errors linked to the program’s problem area for quick troubleshooting
Save work without affecting runtime code
Script programs read like a book with easy to learn commands, such as:
Turn on the Fan
Close the Valve
If Temperature > Setpoint then goto CoolingOn
Because Script programs are composed of basic, everyday language statements, it is easy to follow the logic and quickly understand what the program is doing. Description line names can be added to state the action performed in that section of the program. As a result, users can view diagnostic details of the running program to see how long the condition has been in effect.
Using the built-in Script Debug mode, you can debug script programs using either a single step process or a program trace process. All variables - bound global variables and declared local variables - are shown with their live values for the currently executing line of the Script Program. After debugging is complete, a simple toggle of the mode returns Script Editor to the normal editing process.
To save time and eliminate the need to write a program more than once, StruxureWare Building Operation can easily import and export programs to/from an external library. The Script Editor is an evolution of the Plain English (PE) programming language used by both Infinity and Andover Continuum systems so libraries of PE code can be imported into Script Editor. During the import process, PE code is automatically converted to the updated Script format.
Script Editor supports Plain English (PE) controllers, so you don’t need to learn and program two different sets of formatting rules. Instead, the PE format is applied behind the scenes during the deployment of the controllers that require PE format.
BACnet support provides direct control using specific BACnet services, such as ReadProperty and WriteProperty. Advanced applications can even command BACnet priorities.

Function Block Editor
Create a program by adding function blocks and adding connections between the blocks
Hierarchical blocks collapse functionality into one block, which increases readability
See actual runtime data in blocks - facilitates debugging and verification
Cut/Copy/Paste, Find/Replace, and Undo
Add text, color code lines, change font type, size or color to increase readability
Check and display a list of errors linked to the program’s problem area for troubleshooting
Import previously created programs from library
Save without affecting runtime code
Graphical programming provides a level of readability not seen in other types of programming languages. The visualization of the graphical elements, the blocks, and their connections makes it easy to quickly understand and follow program logic. The readability is further enhanced by the use of the hierarchical function blocks, which allow complex functions to be stored inside one block and thereby create a high-level view of the program.
By using the built-in debugger in the editor, you can simulate the application using single step functionality or simulating patterns on inputs. The online testing is performed in WorkStation where the graphical layout is available and the runtime values can be seen as they are executed, with the possibility to trend log or plot values for troubleshooting and fine tuning.
With Function Block, code can be imported or exported to an external library, so that no code ever needs to be written twice. Because Function Block is an evolution of the TAC Menta programming language used by the TAC Vista system, libraries of Menta code can be imported into the Function Block Editor. During the import process, the Menta code is automatically converted to the updated Function Block format.
Graphics are created and edited using the Graphics Editor: a powerful tool that helps users visualize everything from the field control level to the enterprise level. The Graphics Editor provides a variety of easy-to-use tools to build whatever graphics are required, from a simple line drawing to a photorealistic image. The Graphics Editor can import a wide variety of formats, including .jpg and CAD drawings. JavaScript can also be used to further customize the behavior of each graphic. Animation can highlight changes in the system or make navigation easier. For example, you can create a floor plan view with color-coded temperatures for each zone.
The Graphics Editor is accessed from WorkStation and enables users to create and edit the graphics in systems. WorkStation and WebStation use the same graphics format, so graphics are engineered once.

Graphics Editor
Thermal Graphics: Floor plans can be set up with zones that change color based on the measured temperature, pressure, humidity, usage level or other data provided by the SmartStruxure solution.
Values are updated using the most efficient data retrieval method available. When supported by the SmartStruxure server or the field device, the following methods may be utilized:
Change of value (COV) subscriptions
Read multiple properties at once
To share components and function snippets, they may be drag 'n dropped to email, Skype, or Windows Explorer for easy distribution.
Graphics Editor was designed to help users without strong artistic or technical skills to create great graphics. If the user is more advanced, the possibilities are endless.
Graphical elements can be grouped into reusable components with properties that are easy to edit. Furthermore, function snippets that cause the component to animate or display a certain color based on a value can also be saved and reused. Users can copy a gauge component and change its color, font, and border size without affecting the original functionality.
There are a number of basic drawing tools available within the Graphics Editor. Equipment diagrams, floor plans, maps, navigational maps, and other types of graphics can be created to display dynamic data.
The unique Layers functionality in Graphics Editor facilitates easier editing of graphics with different categories of information. Layers can be controlled through scripting so that the right information is displayed to the right users at the right time.
Graphics can have visual effects, such as gradients, and semitransparent colors. Dynamic rotation, scaling, and movement can also be added based on point values to emphasize important events.
In applications with many similar hotel rooms, offices, or school classrooms, the graphical representation of these rooms are often identical. Graphic objects can share the content so that when you edit one, the changes are reflected in all similar graphic objects, without any extra effort.
Graphics Editor lets you take advantage of photos and graphics created by other vendor's applications. Bitmaps in various formats can be embedded and common vector-based formats can be converted to native StruxureWare Building Operation graphics using Graphics Editor.
Specifications
| Hardware requirements | |
Processor
|
Minimum: Intel Core i5 @ 2.0 GHz or equivalent
|
Recommended: Intel Core i5 @ 3.0 GHz or better
|
|
Memory
|
Minimum: 4 GB
|
Recommended: 8 GB or higher
|
|
Hard disk space
|
Minimum: 20 GB
|
Display
|
Minimum: 1,024x768 pixel resolution
|
Drive
|
DVD drive is required if your copy of StruxureWare Building Operation was delivered on disc.
|
Other devices
|
Microsoft mouse or compatible pointing device is required.
|
| Software requirements | |
Operating systems
|
Microsoft Windows 7 (32-bit)
|
Microsoft Windows 7 (64-bit)
|
|
Microsoft Windows 8.1 (32-bit)
|
|
Microsoft Windows 8.1 (64-bit)
|
|
Microsoft Windows 10 (64-bit)
|
|
Microsoft Windows Server 2008 R2 (64-bit)
|
|
Microsoft Windows Server 2012 (64-bit)
|
|
Microsoft Windows Server 2012 R2 (64-bit)
|
|
| The following Microsoft Windows 7 editions are supported: Professional, Enterprise, and Ultimate. | |
| The following Microsoft Windows 8.1 editions are supported: Pro, Pro N, Enterprise, and Enterprise N. | |
| The following Microsoft Windows 10 editions are supported: Pro and Enterprise. | |
| The following Microsoft Windows Server 2008 R2 editions are supported: Standard, Web, Enterprise, Datacenter, and Itanium. | |
| The following Microsoft Windows Server 2012 and Microsoft Windows Server 2012 R2 editions are supported: Datacenter, Standard, Essentials, and Foundation. | |
Visio versions (WorkPlace Tech Editor)
|
Microsoft Office Visio 2016 (32-bit)
|
Microsoft Office Visio 2013 (32-bit)
|
|
Microsoft Office Visio 2010 SP1 (32-bit)
|
|
Required additional software
|
Microsoft .NET Framework 4.5 or 4.6
|
Microsoft .NET Framework 3.5 SP1 (WorkPlace Tech Editor)
|
|
| Communication (to SmartStruxure servers) | |
HTTP
|
Non-binary, port configurable, default 80
|
HTTPS
|
Encrypted supporting TLS 1.2, port configurable default 443
|
| Graphics | |
Insert Formats
|
PNG
|
BMP
|
|
JPG
|
|
GIF
|
|
Animated GIF
|
|
Import Formats
|
DWF (partial support)
|
DWG (partial support)
|
|
DXF (partial support)
|
|
SVG (partial support)
|
|
| Part numbers | |
| SW-STATION-STD-0, StruxureWare Building Operation WorkStation Standard | |
| For 1 concurrent user per license (No maintenance subscription included) | SXWSWWORK00001
|
| SW-STATION-PRO-0, StruxureWare Building Operation WorkStation Professional | |
| Includes Editor licensing (WorkPlace Tech Editor, Graphics Editor, Function Block, and Script Programming license) | |
| For 1 concurrent user per license (No maintenance subscription included) | SXWSWWORK00002
|
| SW-EDITORS-0, StruxureWare Building Operation Editors | |
| WorkPlace Tech Editor, Graphics Editor, Function Block and Script Programming license only | |
| For 1 concurrent user per license (Used for adding to existing WorkStation Standard license, No maintenance subscription included) | SXWSWEDIT00001
|

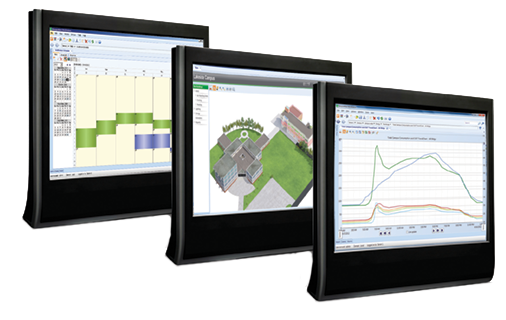
Sample WorkStation interface

Sample WorkStation interface

Sample WorkStation interface