earth_america
user_standard Log on
action_search_stroke
earth_america
Log on to rate and give feedback 1 2 3 4 5 Log on to rate
0
How to

How to


Products: WorkStation, WebReports
Functionalities: Reports
Product version: 1.1, 1.2, 1.3, 1.4, 1.5, 1.6, 1.7, 1.8, 1.9, 2.0, 2.1, 3.0, 3.1, 3.2, 3.3
12/16/2021

Viewing a Dashboard Report in WebReports

You view a dashboard report to see a report based on predefined filtering criteria.

Show More
action_close

A dashboard report is a report that processes fixed or predefined filtering criteria to generate report output.

Unlike prompted reports, dashboard reports process the report output based on the predefined filtering criteria and generate the report output when you select the report. You do not need to enter filtering criteria or click the Run button to generate the report.

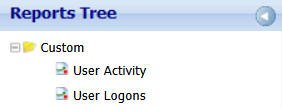
In the Reports Tree, dashboard reports are identified by a red dot next to the report name. The icon does not appear next to dashboard reports in the System Tree pane in WorkStation.

 
action_zoom_plus_stroke Dashboard reports in the Reports Tree

Dashboard reports in the Reports Tree

Predefined Filtering Criteria

You can create dashboard reports in both WorkStation and your Web browser using the WebReports dashboard option. You select the option when you want to create a report that uses the same filtering criteria each time you run the report. For example, suppose you want an alarm report to process with a fixed date range, such as week to date. When you create the report, you can enter the fixed date range and then save the report as a dashboard report. The next time you run the report, the report processes using the fixed date range as the filtering criteria. You do not need to reenter the date range to filter your report output.

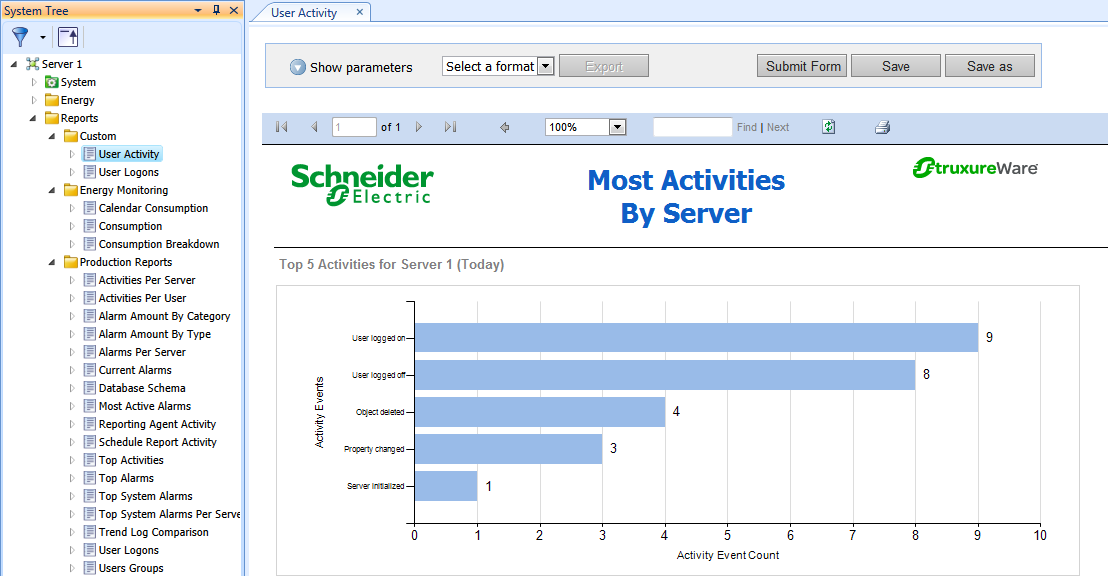
To generate and view a dashboard report in WorkStation, you select the report in the Reports folder in the System Tree pane.

 
action_zoom_plus_stroke Dashboard report in Workstation

Dashboard report in Workstation

After you select the report, the report output displays in the Work area. You do not need to enter any filtering criteria, or click the Run report button to generate the ouput.

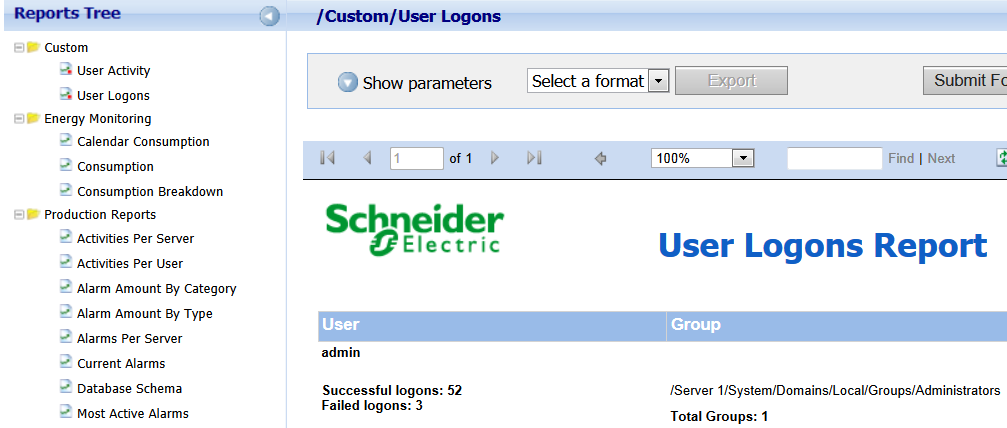
To generate and view a dashboard report in your Web browser, you log on to the WebReports Web site, and then select a report in the Reports Tree.

 
action_zoom_plus_stroke Dashboard report in a Web browser

Dashboard report in a Web browser

After you select the report, the report output displays in your Web browser. You do not need to enter any filtering criteria, or click the Run report button to generate the output.

Schedules for Dashboard Reports

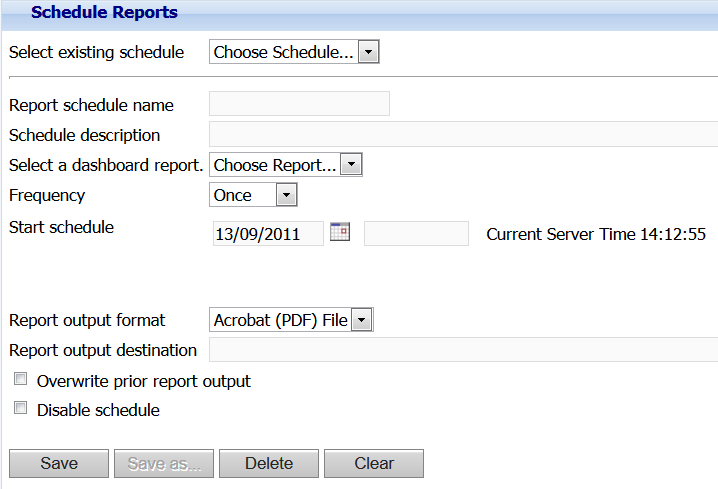
You also create dashboard reports when you want to use WebReports Schedules and run reports on specified days. For more information, see Schedules for Dashboard Reports ..

 
action_zoom_plus_stroke WebReport Schedule

WebReport Schedule

To view a dashboard report in WebReports
  1. In WebReports, on the menu bar, click View .

  2. In the Reports Tree , select a previously saved dashboard report.

  • Dashboard Reports
  • WebReports View Page
  • Creating an Activities Per User Dashboard Report
  • Creating a Trend Log Comparison Dashboard Report
  • Viewing a Dashboard Report in WorkStation
  • Creating a Dashboard Report in WorkStation
  • Creating a Dashboard Report in WebReports
  • Creating a Consumption Dashboard Report