
How to
Configuring the X Axis with a Relative Time Span
You you configure the trend chart time span of the x axis relative to the series current end point time to automatically adapt the trend chart to display the current time and the latest records within the specific time span.
The x-axis of the trend chart represents time. The time span of the axis can be set with a fixed start and end time or with an end time relative to the present time. The axis can be quick-scaled to show the last hour, last day, last month, or last year.

Absolute time span and relative time span, schematic
The y-axis refers to the measurement unit that the variable represents. The scale of the y-axis can be set manually or by auto scale. You can configure the trend chart to present series on one y-axis or two y-axes, one to the left and one to the right. Use two y-axes to present series with different ranges in the same trend chart.

One y-axis and two y-axes, schematic
To make reading easier, grid lines can be shown in the trend chart. Grid lines can be shown in both the x- and y-direction, independent of each other.

Grid lines, schematic
In WebStation, in the System Tree pane, select the trend chart you want to configure.
On the Trend Chart toolbar, click Settings .
Click the Axis tab.
In In the Time mode box, select Relative .
action_zoom_plus_stroke 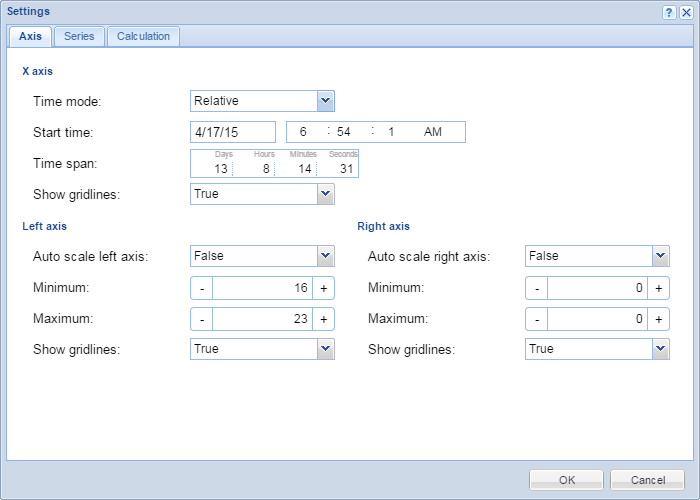
In the Time span box, enter the time span.
Click OK .
The x axis is now configured with a time span relative to current time.
 Trend Chart Axes in WebStation
Configuring the X Axis with an Absolute Time Span
Showing Trend Chart Grid Lines
Manually Configuring the Y Axis Scale
Automatically Configuring the Y Axis Scale
Saving Current Trend Chart Settings
Trend Chart View
Trend Chart Axes in WebStation
Configuring the X Axis with an Absolute Time Span
Showing Trend Chart Grid Lines
Manually Configuring the Y Axis Scale
Automatically Configuring the Y Axis Scale
Saving Current Trend Chart Settings
Trend Chart View
 Trend Chart Toolbar
Trend Chart Settings Dialog Box – Axis Tab
Trend Chart Toolbar
Trend Chart Settings Dialog Box – Axis Tab