
How to
Manually Configuring the Y Axis Scale
You manually configure the trend chart y axis to have a fixed scale. The trend chart has two y axes, one to the left and one to the right. You can use this procedure to scale both axes.
The x-axis of the trend chart represents time. The time span of the axis can be set with a fixed start and end time or with an end time relative to the present time. The axis can be quick-scaled to show the last hour, last day, last month, or last year.

Absolute time span and relative time span, schematic
The y-axis refers to the measurement unit that the variable represents. The scale of the y-axis can be set manually or by auto scale. You can configure the trend chart to present series on one y-axis or two y-axes, one to the left and one to the right. Use two y-axes to present series with different ranges in the same trend chart.

One y-axis and two y-axes, schematic
To make reading easier, grid lines can be shown in the trend chart. Grid lines can be shown in both the x- and y-direction, independent of each other.

Grid lines, schematic
In WebStation, in the System Tree pane, select the trend chart you want to configure.
On the Trend Chart toolbar, click Settings .
In the Auto scale left axis box and the Auto scale right axis box, select False .
action_zoom_plus_stroke 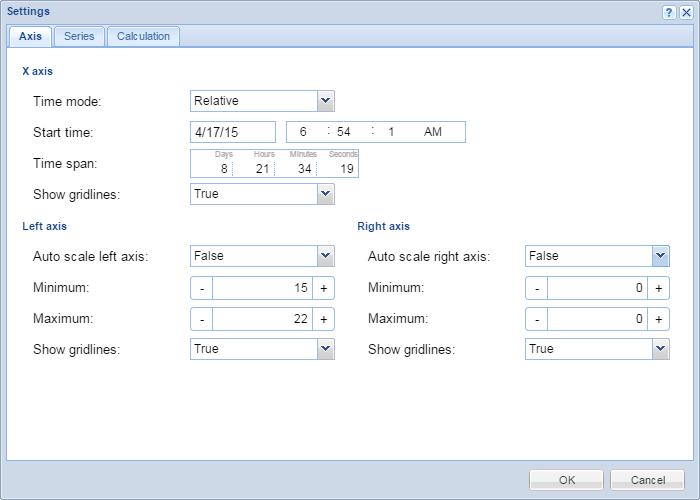
In the Left axis Minimum and Maximum boxes, type the minimum and maximum value of the left axis.
In the Right axis Minimum and Maximum boxes, type the minimum and maximum value of the right axis.
Click OK .
 Trend Chart Axes in WebStation
Configuring the X Axis with a Relative Time Span
Configuring the X Axis with an Absolute Time Span
Showing Trend Chart Grid Lines
Automatically Configuring the Y Axis Scale
Saving Current Trend Chart Settings
Trend Chart View
Trend Chart Axes in WebStation
Configuring the X Axis with a Relative Time Span
Configuring the X Axis with an Absolute Time Span
Showing Trend Chart Grid Lines
Automatically Configuring the Y Axis Scale
Saving Current Trend Chart Settings
Trend Chart View
 Trend Chart Settings Dialog Box – Axis Tab