
How to
Setting Up a Report
You set up a report to include items such as tables or charts, and associate them with your datasets.
In MS Report Builder, in the Design view, click the Insert tab and select an item in which to display your report data.
action_zoom_plus_stroke 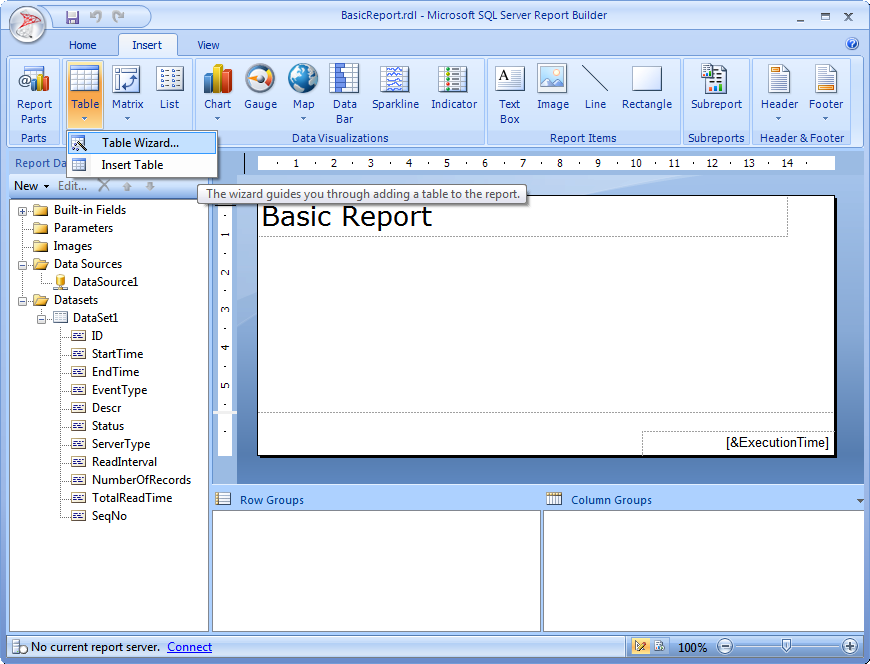
Select an existing dataset to use with the item you inserted.
Note:Not all items that you can insert offer the option of choosing a dataset, only those items that have wizards. If you insert other types of items, you can drag dataset properties to them at a later stage. The following dialog boxes apply to a table wizard.
action_zoom_plus_stroke 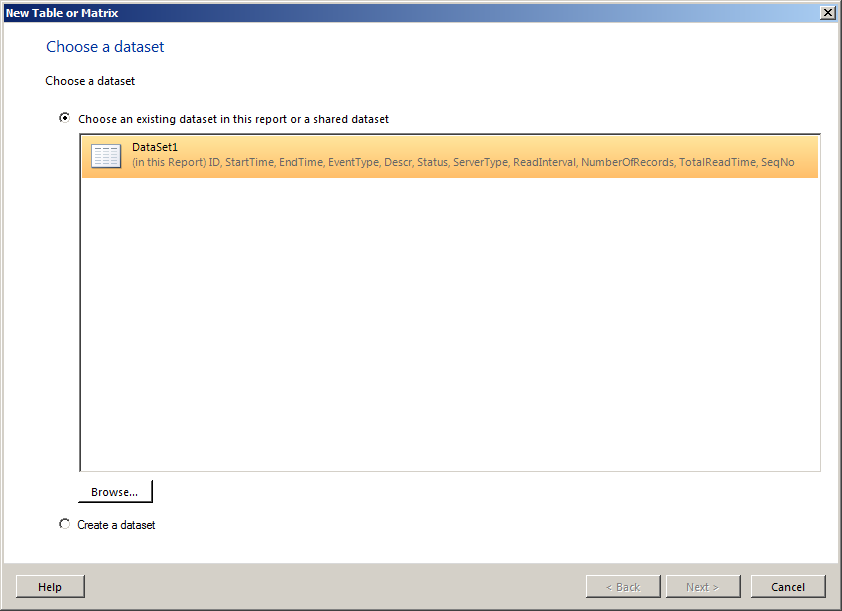
Click Next .
In the Available fields box, select a field and drag it to Row groups , Column groups , or Values . Create grouping and aggregate sections as needed for report summing and counting.
For up-to-date descriptions of the WebReports database fields that you use when creating your own reports in MS Report Builder, you can run the Database Schema factory supplied report. For more information, see Database Schema Report .
action_zoom_plus_stroke 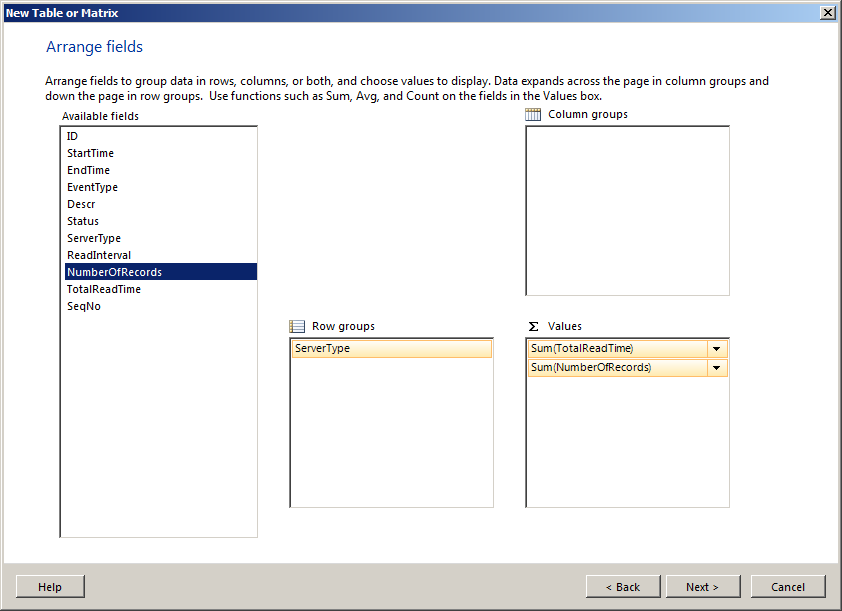
Preview the layout of your report.
action_zoom_plus_stroke 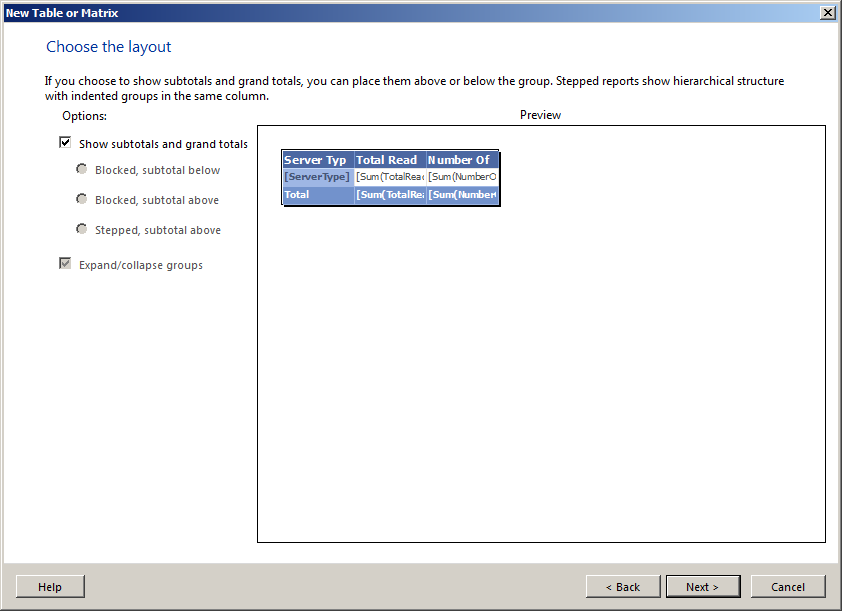
Click Back to go back and rearrange your fields, or to add new fields as necessary.
Click Next .
In the Style box, select a style.
action_zoom_plus_stroke 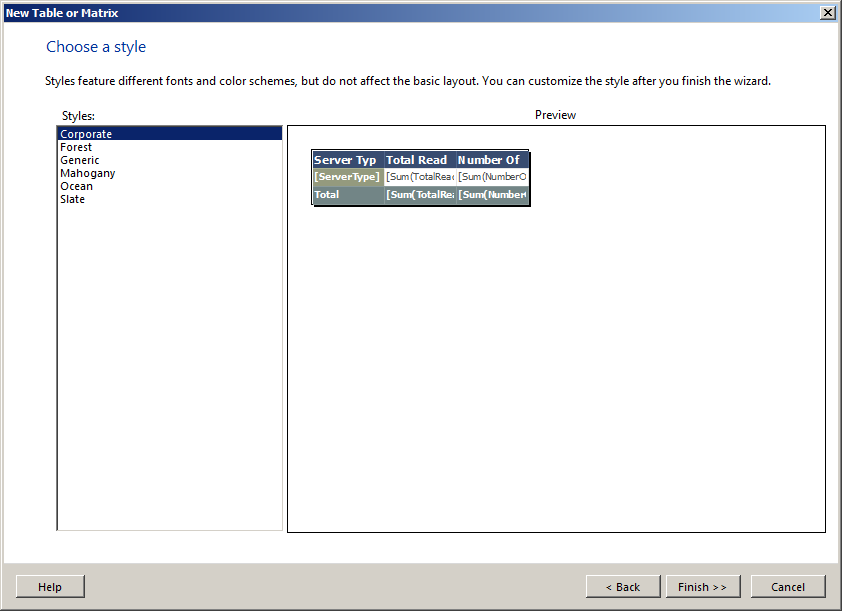
Click Finish .
action_zoom_plus_stroke 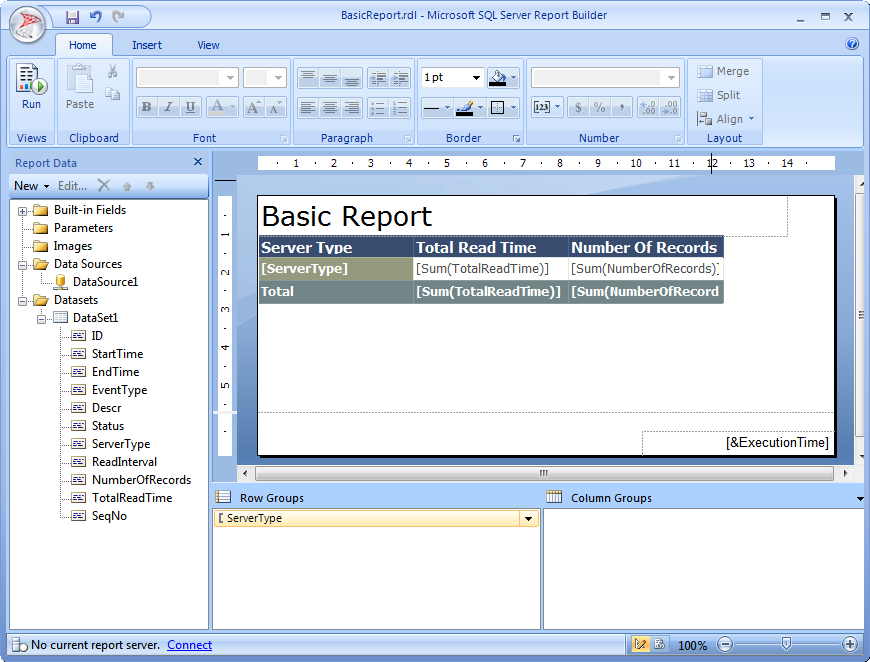
Click the Save button, then click Run .
action_zoom_plus_stroke 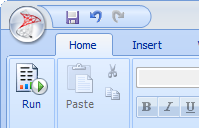
View the generated report.
action_zoom_plus_stroke 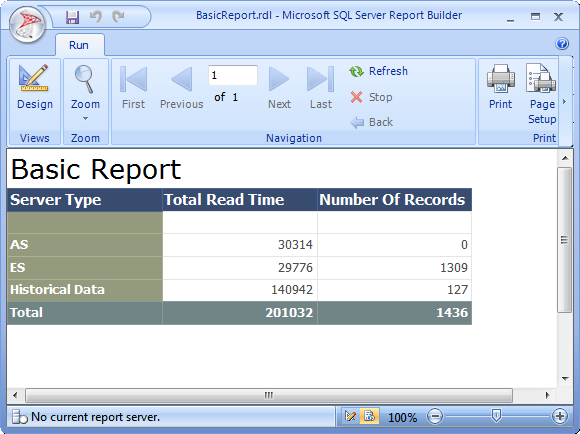
You can now add an image to your report, or you can upload the report to the Reports Server.
 Reports in Report Builder
Database Schema Report
Adding an Image to a Report
Deploying a New Report to the Reports Server
Reports in Report Builder
Database Schema Report
Adding an Image to a Report
Deploying a New Report to the Reports Server