Concept
System
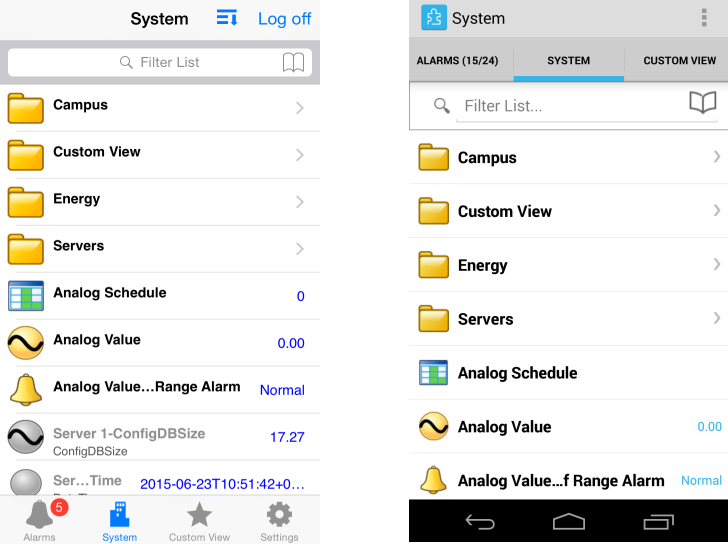
System displays the entire tree structure of Building Operation as it appears in WorkStation.
The values of the grayed out variables without the Force option are read-only values that you can not change.
The values of the grayed out variables with the Force option can be changed when you force ON . For more information, see Forcing a Value .
A warning icon next to a variable means that the value cannot be converted and may not represent what you are expecting to see. For example, the power consumption variable cannot have units in g/m 2 . The unit should be kWh. This error is represented by warning icon.
The value is displayed in blue font when the value is not older than 3 minutes and there is no network failure.
Using the built-in swipe-to-refresh feature, values and objects can be easily refreshed in System as well as within a particular folder in System .
You can scroll through the long list of objects and variables in System as well as within a particular folder in System using quick scroll bar.
Objects and variables are listed in the same order as in WorkStation.
Objects and variables listed in System vary according to the software permissions assigned to the user who has logged into Technician Tool. For more information, see User Account Profile Workflow .
Trend Logs
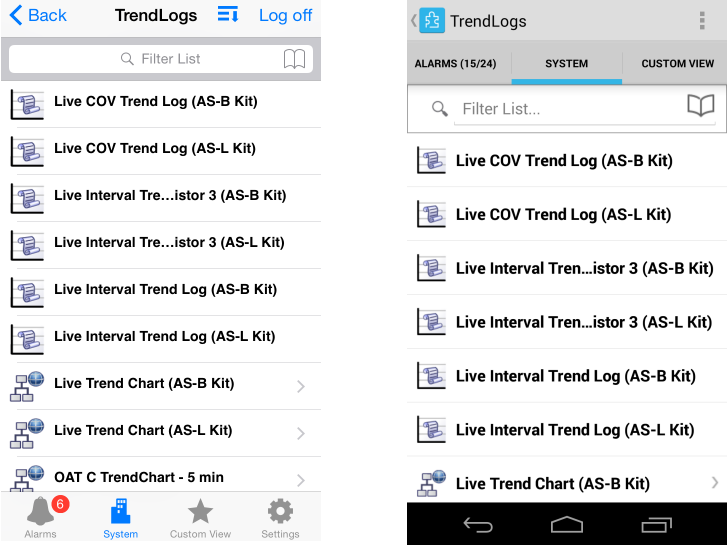
You can view a list of trend logs and their properties. You can filter the trend logs based on date and time as well as search logs based on value. You can view the name, type, and source of trend log.
For more information, see Viewing Trend Logs .
Schedules
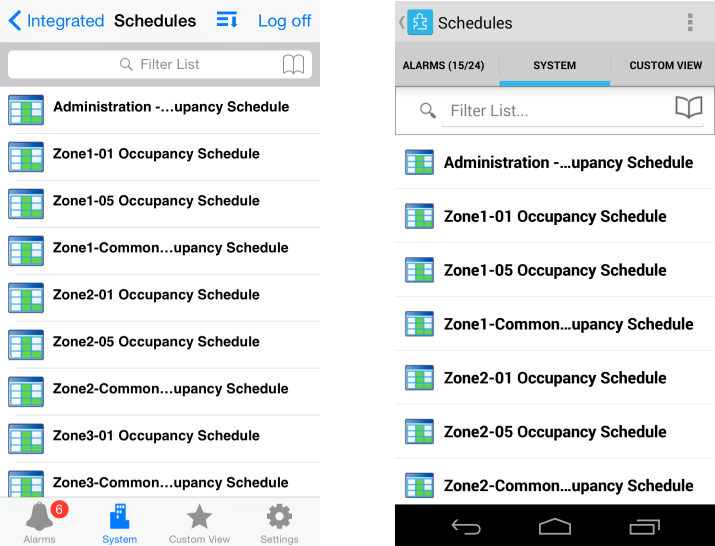
You can view a list of schedules and manage a schedule. Schedule operations are the same as in WebStation.
Schedules are used to schedule the operation of part of the building management system, such as a fan, a door, or a setpoint. Using a schedule, a fan can be set to operate between 08:00 and 17:00 every workday.
Schedules can be overridden by different types of exceptions. For example, if you want to shut the fan down the last Friday in every month due to maintenance, you can use a calculated exception. The exception is added to the schedule and turns off the fan the last Friday in every month.
If you want to shut down the fan during the summer vacation, you can use a Calendar exception. In this case, you use an already created calendar that defines the summer vacation. This calendar is added to the schedule as an exception and the fan will be shut down during all days of the summer vacation defined by the calendar.
You can view schedule details only in landscape mode.
For more information, see Viewing Schedules .
Graphics
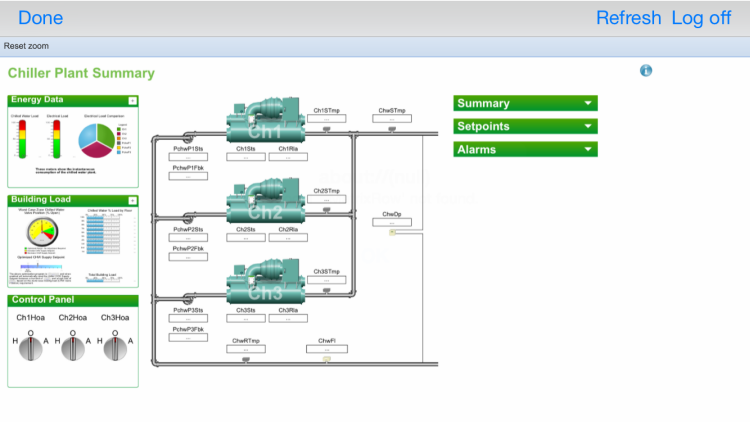
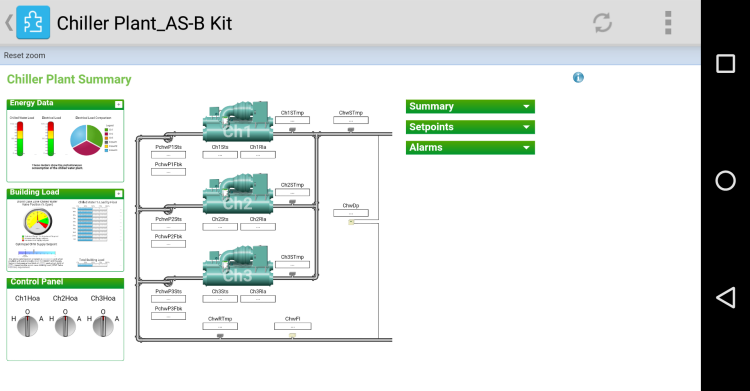
You use graphics to display building overviews, display values from sensors, or change setpoints. A graphic can also contain links to trend charts, trend log lists, Internet sites, or views in WorkStation and WebStation.
You can view graphics only in landscape mode and also refresh the graphics.
Panel objects are not supported in Graphics.
